SQM data at Solar Hills Observatory

Graphs on this page are updated every 5 minutes (barring glitches)
All-Sky videos and data updated by 1430 UTC each day (barring glitches)

Most recent graph of magnitude per square arc-second (Time in UTC)

SQM-DU-DL data in IDA Skyglow format
(data runs from Nautical Twilight to Nautical Dawn)

SQM-DU-DL data in graphical form

SQM-DU-DL data in Knightware SQM Reader 3 Pro
(data runs from evening to morning)


AAG CloudWatcher data in CSV form

AAG CloudWatcher data in graphical form

TESS data (uploaded daily at 1435 UTC)


Link to CSU animation files for GOES-16 images

AllSky Camera images

Every 5th frame (about 5 minutes apart) extracted from AllSky Camera images


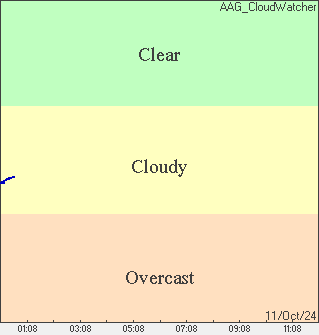
Most recent graph of
CloudWatcher Cloud Condition (Sky temp.)

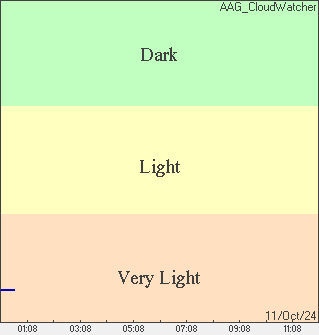
Most recent graph of
CloudWatcher Brightness (NOT SQM)

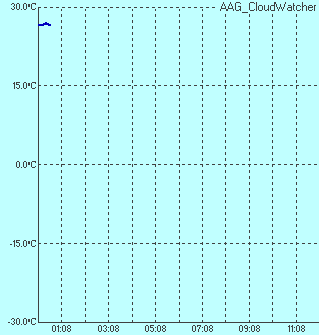
Most recent graph of CloudWatcher
Ambient Temperature

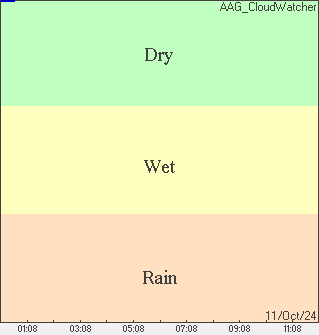
Most recent graph of
CloudWatcher Rain (Moisture sensor)


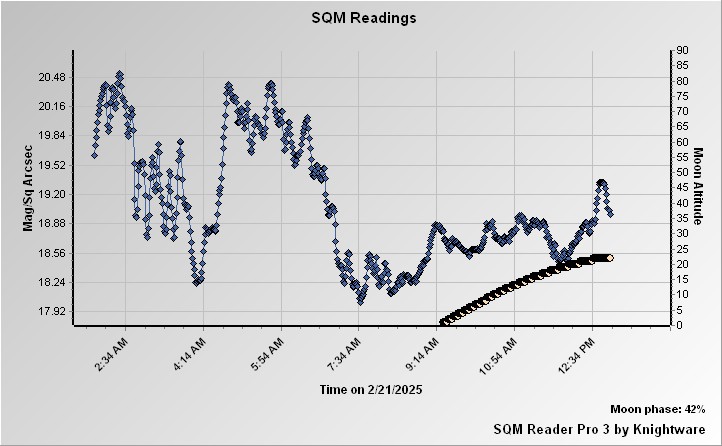
Most recent graph of
TESS brightness (MPSAS / NELM)

Most recent graph of
TESS IRT (d C)

Copyright Bryan Cashion,